
infrastructure
Your grid already holds more information than you can see
At the same time, utilities are expected to maintain service quality, demonstrate compliance and direct investment where it will have the greatest effect.
Much of the information needed to understand these conditions may already exist across smart meters, power-quality-capable devices and operational systems. The challenge is bringing that data together, establishing its quality and turning it into information that teams can use.
EYKON Grid Analytics helps utilities build a clearer view of network performance from the infrastructure already in place.
Analytics
See beyond the data
Grid Analytics gives operations, planning, compliance and customer-service teams a shared view of voltage and power-quality conditions across the network.
Monitor voltage levels and identify persistent overvoltage, undervoltage, imbalance, dips and swells across supported measurement points.
This helps teams locate recurring issues, investigate complaints and understand where changing load or local generation is affecting network conditions.
Assess relevant power-quality indicators across supported devices and applications, including harmonics, flicker and rapid voltage changes where available.
A more consistent view of service quality helps utilities understand disturbances, protect critical assets and support evidence-based investigations.
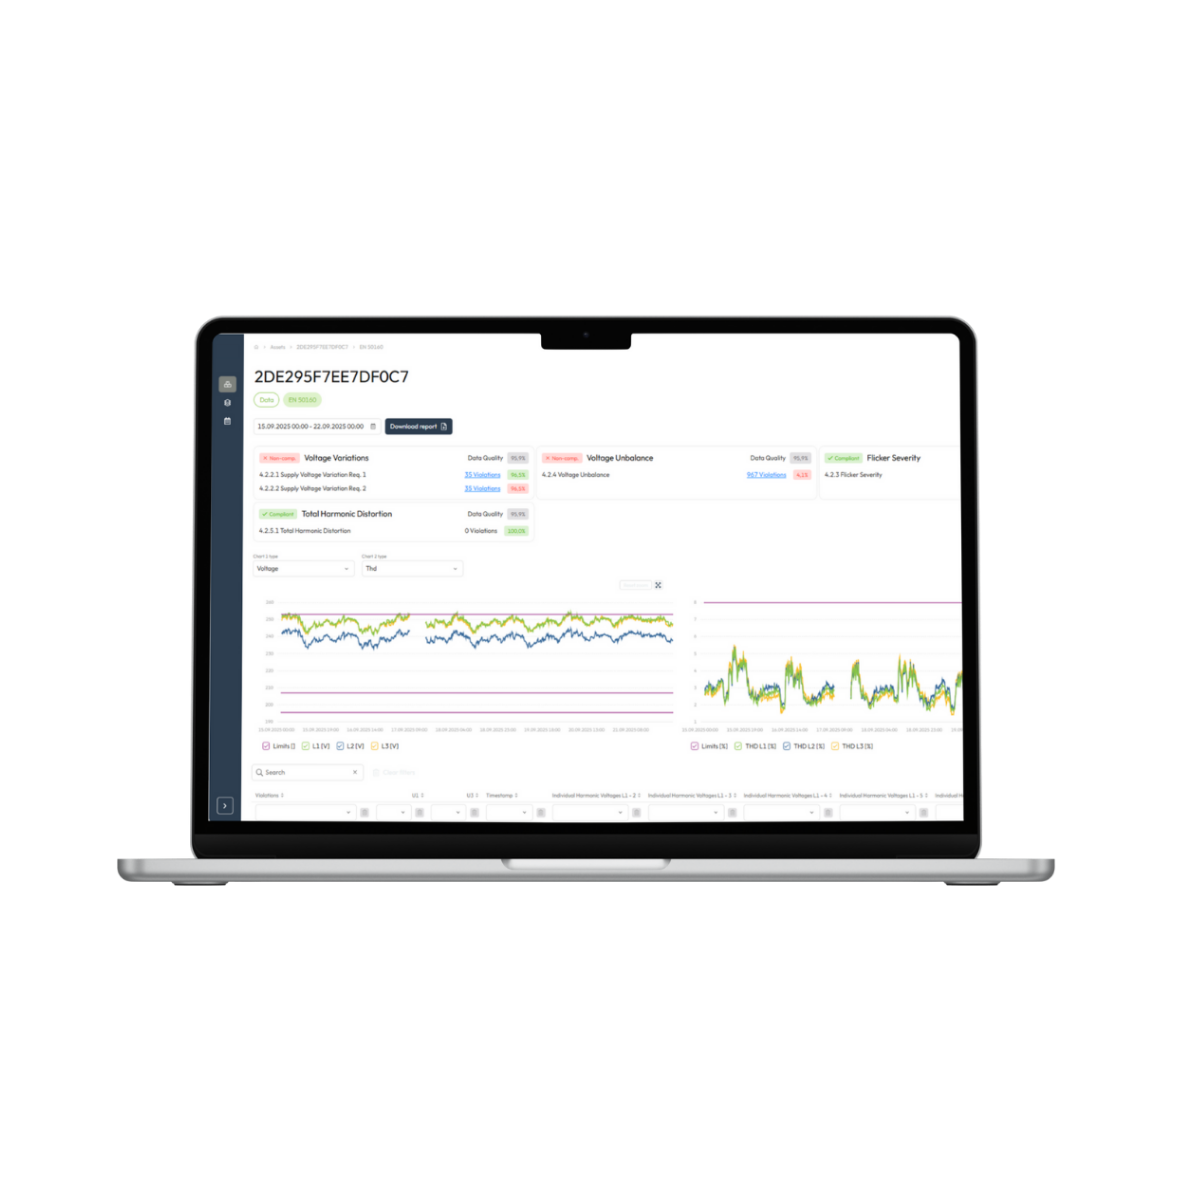
Automated evaluations and reporting can reduce the manual effort required to assess voltage quality against EN 50160 and applicable national requirements.
The resulting evidence can support regulatory reporting, audits and the resolution of customer power-quality cases.
Trends, maps and ranked exceptions help teams identify persistent hotspots, compare areas of the network and direct further investigation.
Rather than presenting every available measurement, the solution helps users focus on conditions with the greatest operational relevance.
trusted data
From distributed data to a clearer network view
Greater network visibility begins with trusted data. By combining information from smart meters, power-quality-capable devices and existing systems, utilities can better understand conditions across the network and act when needed.
Monitor
Bring together relevant information from smart meters, power-quality-capable devices and existing systems.
Analyse
Organise data into maps, trends, evaluations and exceptions that reveal how network conditions are changing.
Prioritise
Identify recurring issues, areas of asset stress and locations that warrant investigation, maintenance or further planning.
Improve
Use stronger evidence to guide operational responses, compliance processes and investment decisions.
FAQ
Start with the operational question
Different utility teams need different answers. Grid Analytics can be applied to the use cases that matter most, then extended as requirements develop.
Identify recurring voltage deviations and compare conditions across feeders, substations and connected measurement points.
clear values
Make more use of infrastructure already in place
Grid visibility does not always begin with a new layer of field equipment.
Supported smart meters and grid devices already collect voltage, power-quality, event and load information at locations across the network. Grid Analytics brings relevant data into one analytical environment, where it can be checked, organised and interpreted for operational use.
The solution can work with existing metering infrastructure, HES platforms and operational data sources. This allows utilities to begin with a defined area or use case and extend coverage as the value becomes clear.
needs
Analytics built around practical utility needs
Maps, trends, asset-level information and prioritised exceptions help users move from broad network data to the points that require attention.
Analytics are only as reliable as the data behind them. Coverage and data-quality information help users understand where evidence is complete and where limitations need to be considered.
Assess relevant power-quality indicators across supported devices and applications, including harmonics, flicker and rapid voltage changes where available.
A more consistent view of service quality helps utilities understand disturbances, protect critical assets and support evidence-based investigations.
Utilities can begin with a focused requirement, such as voltage monitoring or service-quality reporting, and add further analytical capabilities where supported and required.
Relevant results can be shared with downstream operational and enterprise systems through supported interfaces and reporting methods.
The analytical environment processes and presents network information without adding the full data-processing burden to existing operational systems.
FAQ
Designed for regulated utility operations
The solution evaluates supported measurements against defined criteria and can produce scheduled reports and evidence for EN 50160-related processes.
Products
Featured technologies
Contact